The causal map is a very powerful tool in Lean product development.
It is a diagram that links the customer value variable, which represents the degree of customer value for a product, unit, or technical element, and the technical variables, or design variables, that make up the product, in a cause-and-effect relationship. Using this causal map (cause-and-effect) map in product development can greatly improve development efficiency and increase the probability of innovation.
This article explains what a causal map is, how to create one, and how to use it to accelerate product development innovation.
Contents of this article
What is a causal map?
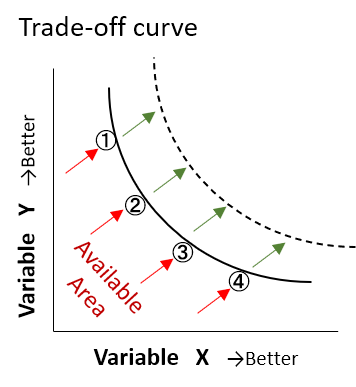
In his book “The Lean Product Development Method”, Allen Ward mentions the trade-off curve as a very important tool in lean product development.
He states that the cause-effect diagram (cause-effect map) is used to clarify the existence of trade-offs in product development.
By accurately grasping the trade-offs during product development and sharing them within the organization, design quality can be improved and rework can be eliminated.
Tradeoffs mean that if you try to raise one of the two customer value variables that you should aim for in your product, you will have to lower the other one.
In other words, it is the basis for indicating that a balance between the two customer values must be chosen, which means that it indicates the limit point of the current technology.
In order to go beyond this limit point and improve the two variables in a positive direction, the development team will recognize that some breakthrough new technology development is needed.
The most important significance of Lean product development is to share and accumulate “knowledge” in the organization.
The “knowledge” to be utilized is
- Knowledge about customer value
- Knowledge about product development technology
That’s all.
The causal map is a diagram (map) created by connecting customer value variables and design variables with causal relationships.
Reference Articles:
Understanding Set-Based Development
Example of a causal map – Vacuum cleaner
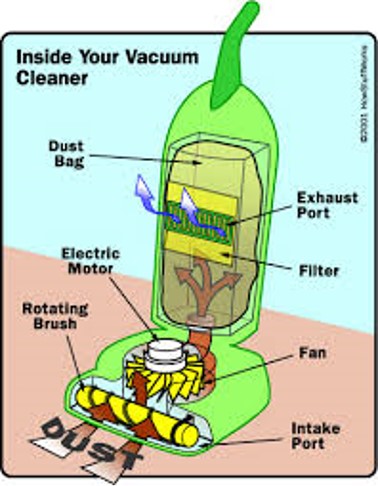
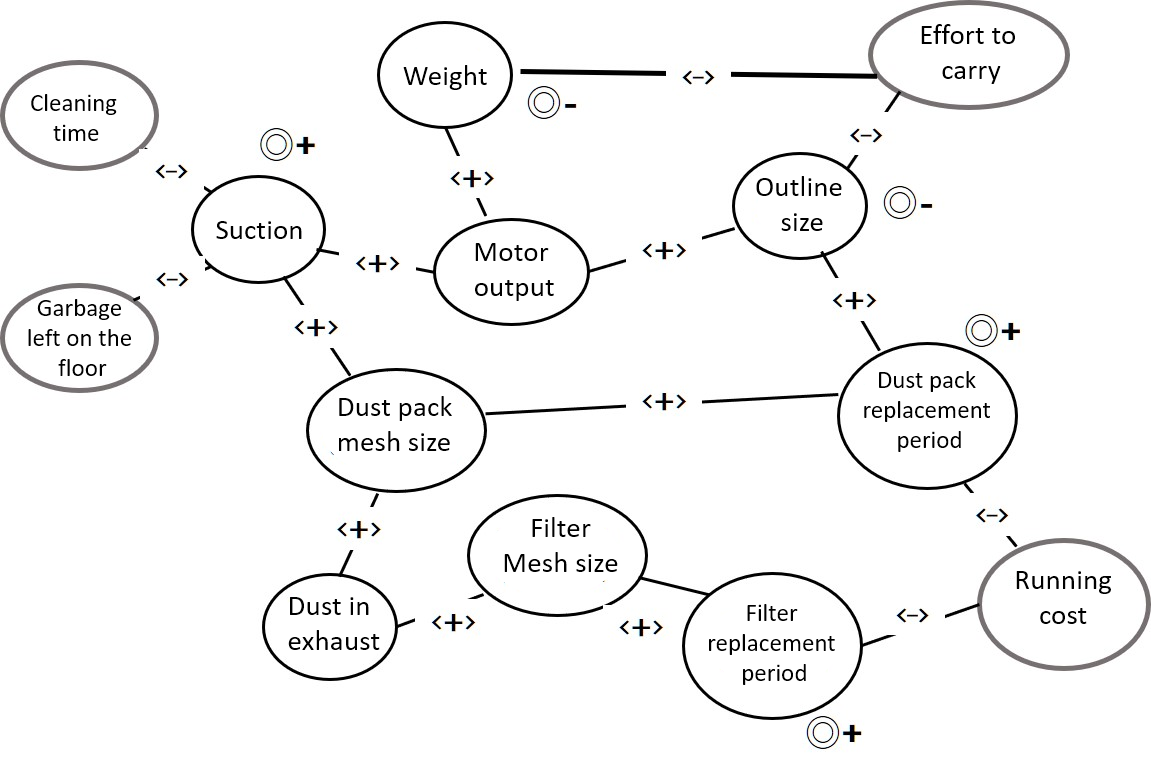
As an example of a causal map, let’s consider a vacuum cleaner.
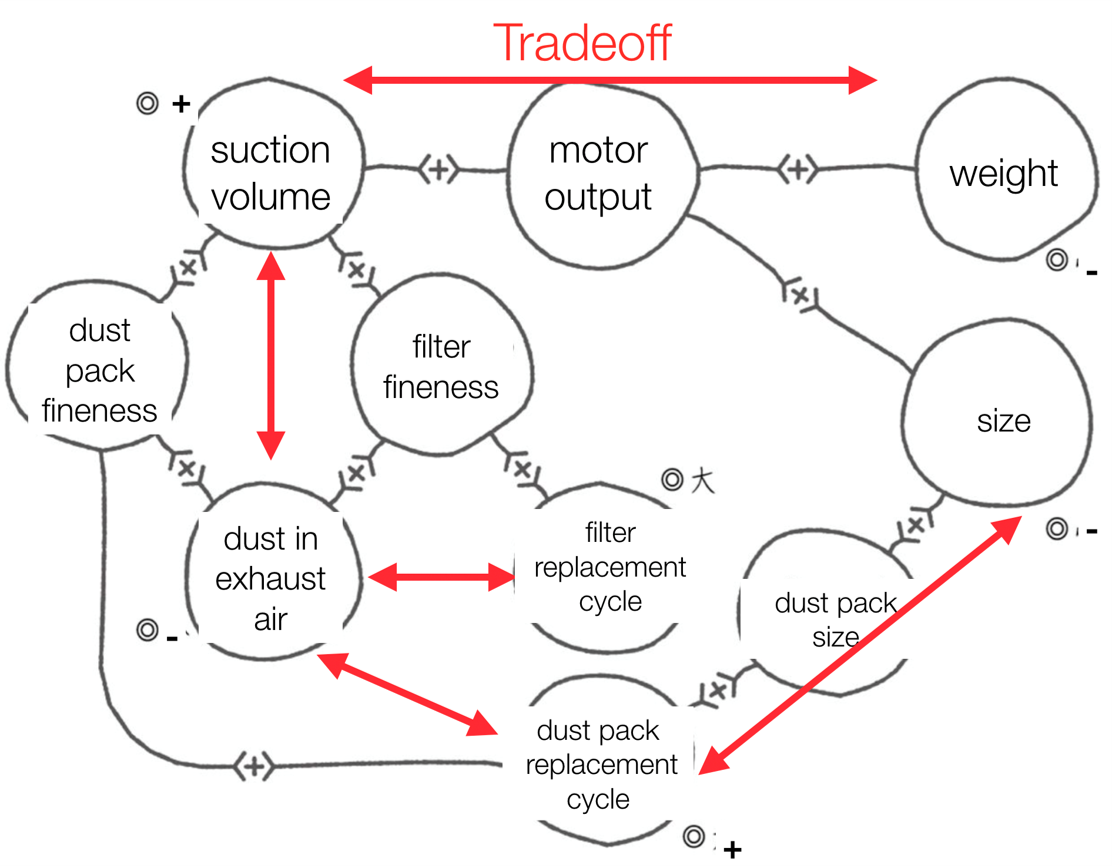
The rules for creating a causal relationship map are
- Capture customer value variables and design variables and surround them with circles
- Place a ◎ sign outside the circle for the customer value variable
- When a larger customer value variable is desirable, it is indicated with a plus sign, and vice versa with a minus sign
- Connect variables that have a causal relationship with each other with a line
- If the relationship between the variables is positive, put a + sign, and if it is negative, put a – sign.
If the relationship is positive, one variable increases while the other increases, and vice versa for negative relationships
This is the case.
The causal map for the electric vacuum cleaner is shown in the figure below.
How to create a causal map
There are no rules on how to make a causal map.
Basically, as long as the rules of creation are followed, you can create the procedure in any way you feel comfortable.
However, there is a procedure that we recommend.
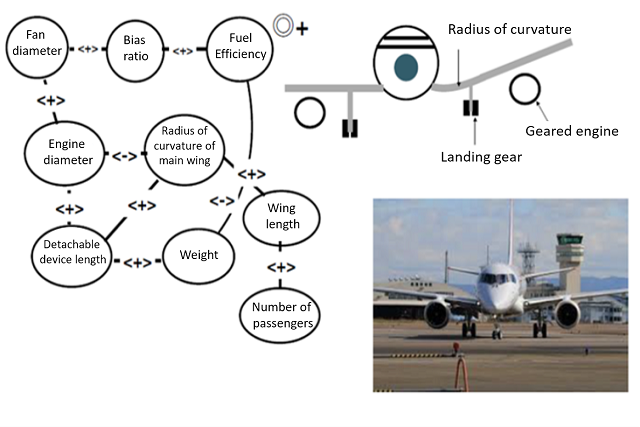
For example, if you want to see the general structure and principles of the entire product, first list all the customer value variables.
Distribute the listed customer value variables as shown in the figure below, leaving the central part empty.
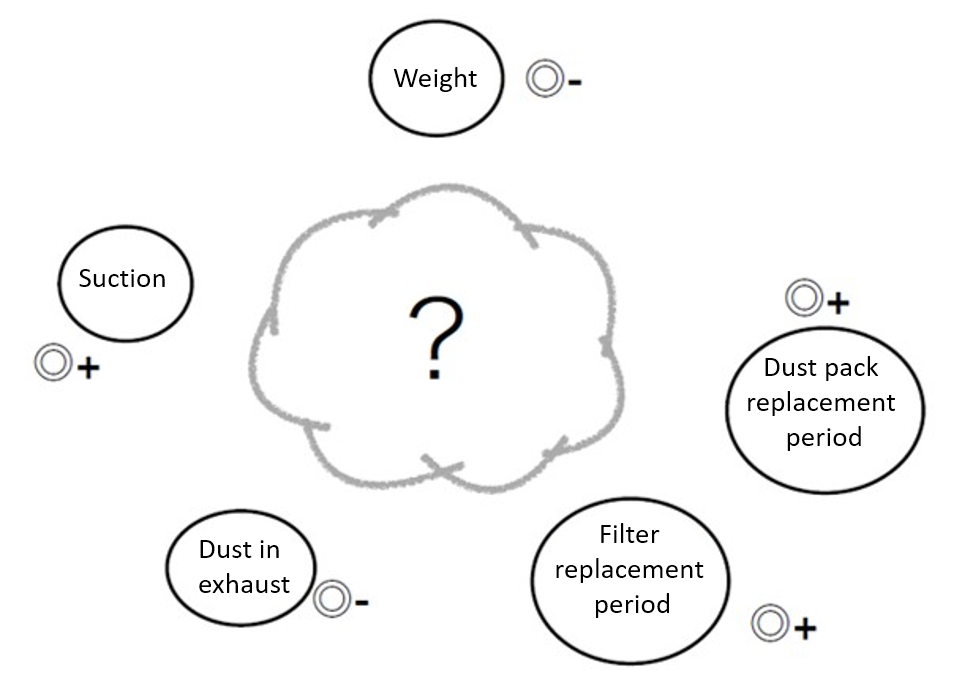
In the figure, the ? mark in the figure, we will fill in the design variables.
We will consider the design variables that affect each customer value variable.
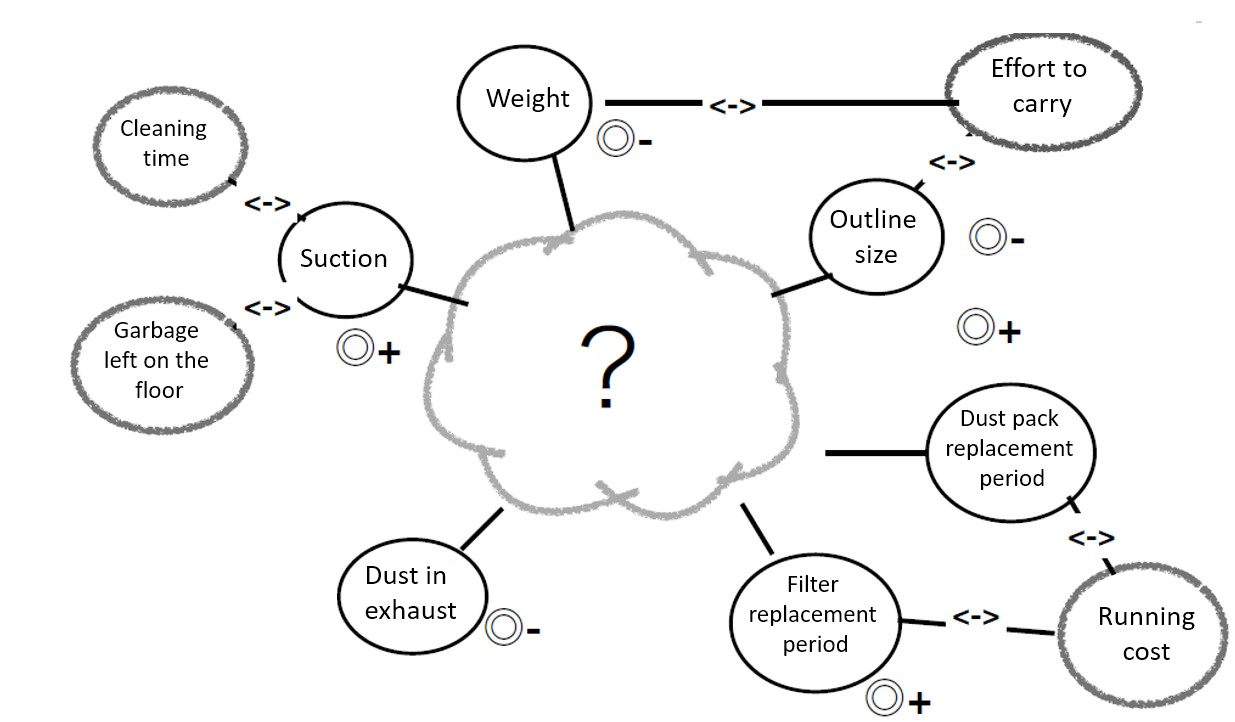
As you fill in the information little by little, verify the causal relationships between variables and complete the causal map.
This approach is useful when you need to find trade-offs between multiple customer value variables.
In addition to this approach, for example, if there are multiple customer value variables, but you want to focus on one important customer value variable and examine how you can break through that customer value variable, you can focus only on the important customer value variable and examine the design variables.
This method is sometimes used for problem solving and idea examination.
First of all, let’s actually make it and find a way to make it that suits our company through experience.
How to use the causal map and cautions
The causal map can be used in various situations in the product development process.
The following are some of the main ways to use them.
- Understand the general structure of the product system
- Clarify trade-off relationships between customer value variables
- As a clue to the cause of a problem in order to solve it
- Understand what you don’t know
- Identify areas of attack for innovation
Let’s look at each of these.
Understand the general structure of the product system
One of the problems I’ve noticed is that when minor changes are made to existing products over and over again, engineers in the field sometimes work without understanding the overall structure and principles of the product.
This is because you don’t need to know the whole picture, and you can do your job if you only know the unit you are in charge of. However, if you can have a bird’s eye view of the whole product again, you will have many advantages, such as broadening your scope as an engineer and facilitating problem solving.
In addition, once a cause-and-effect relationship map has been created, it helps to deepen the same understanding of the overall product within the organization, which in turn facilitates technical communication.
Clarify trade-off relationships between customer value variables
The main purpose of developing a new product through product development is to increase customer value.
Although we would like to increase all the customer values associated with the product, we cannot increase all the customer values at the same time if there are trade-offs between several customer value variables.
The trade-offs are represented by a trade-off curve, and only one point of the combination between the customer value variables on the trade-off curve is the best choice that can be made.
Whether to give priority to variable X, Y, or a 50:50 balance is the choice for product planning.
If you do not understand this trade-off, you will not be able to clearly argue with the sales and planning departments when they demand that you increase both.
It becomes a confrontational structure like sales/planning vs. development, and a proposal is created with a balance of multiple customer value variables beyond the trade-off curve in a mental argument.
Of course, there is nothing wrong with aiming for high customer value as a new product, but unless you proceed with a clear understanding of whether the development can be done with the current technology or whether it requires a breakthrough, you will not be able to read the schedule and risks.
Also, if you proceed with development without knowing whether it is within the current technology or a new development, you will waste a lot of time.
It is essential for an organization to recognize the limits of the current technology and the current product configuration as a trade-off curve in order to plan the correct product planning and development schedule.
A clue to the cause of the problem in order to solve it
To some extent, quality problems are inevitable in product development.
The more challenging the product is to develop, the higher the risk of quality problems.
The ability to quickly solve quality problems when they occur is the key to the development capability of an organization.
Of course, the most important thing is to prevent problems from occurring, but I believe that problem-solving ability is the second most important organizational strength.
Quality problems may appear as phenomena that affect customer value variables, or they may appear in the form of failure to meet the standard values of design variables set to protect customer values, although they do not affect customer value variables.
In either case, an abnormality will appear in one of the variables on the causal relationship map, and by following the chain of causality on the causal relationship map, it will be easier to identify the location where the problem occurs.
In order to solve problems efficiently, it is also important to know how many possibilities you can come up with for the cause of the occurrence based on the phenomenon that is happening.
To do this, you need to understand the overall structure of the product, the connections between units, and how they work together.
Having a cause-and-effect map of the product in your mind will give you a better understanding of the overall structure of the product and the linkages between units.
It means that the entire development team can strengthen their problem-solving skills by creating a cause-and-effect map, understanding it, and using it as a common knowledge base.
Understand what you don’t understand
I believe that the decreasing number of people who understand the entire product in an organization is a problem for many manufacturing companies today.
Veterans are retiring without leaving their knowledge behind in the company, leaving behind only those who have partial knowledge but no solid understanding of the entire product.
I think one of the reasons is that by dividing the development work among different functions, the development of the entire product progresses.
There may not be many opportunities for each engineer to learn what they don’t know.
In the first place, they are usually so busy developing their own units that they may not have time to reflect on what they do not understand.
A causal relationship map may look easy when you look at the example of a vacuum cleaner, but if you try to create one from scratch, even for your own product, you will find it surprisingly difficult.
There is the difficulty of remembering the rules of cause-and-effect mapping, but in the first place, you need to know the product really well to be able to create it.
In short, when you try to create a cause-and-effect map, you will find that there are many things you don’t know.
This is quite an important thing.
When people who thought they understood the product to some extent try to make a cause-and-effect map together, they find out that they surprisingly do not know the principles of the product.
If you don’t know, you can ask someone or study it yourself.
You will find that you have not been doing even such obvious things before.
The cause-and-effect map exposes the knowledge we don’t know and tells the organization what we need to learn as an organization.
Finding the right place to attack for innovation
A causal map is a tool that represents the composition and principles of existing products.
It illustrates the connection between customer value variables and design variables. Developing a product with a new concept, so-called innovation, is ultimately about increasing customer value, or creating new customer value.
If the current mechanism of creating customer value is represented in a causal relationship map, it can be used as a document to examine where to take action on design variables in order to create new customer value, or where to create new design variables to increase customer value or break the current trade-off balance.
There is a toaster oven called Aladdin developed by a company called Sengoku Co.
This toaster has a special heater called far infrared graphite that can heat up to the required temperature of several hundred degrees Celsius in 0.2 seconds, dramatically shortening the baking time and providing customers with bread that is crispier on the outside and fluffier on the inside than other toasters. As a result, the product has become a big hit.
Let us now consider the causal map of the toaster.
In this case, we will first take the customer value variable “baking time”, which we think is the most important.
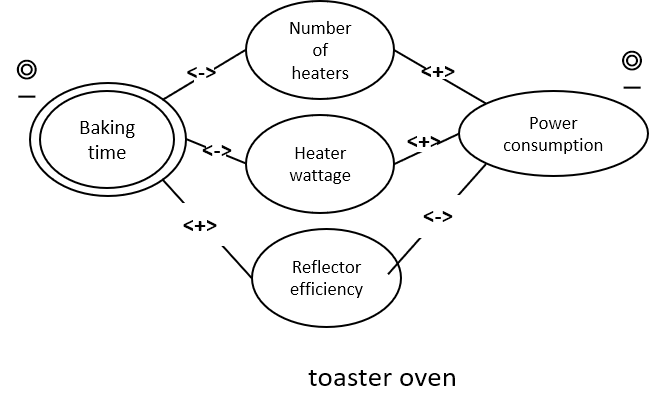
First, considering the structure of a typical toaster oven, we can simply connect the design variables of number of heaters, number of heater wattage, and reflector efficiency, which are thought to affect the baking time, with the baking time in a causal relationship.
At the same time, it is easy to think that by increasing the power of the heaters to shorten the baking time, the power consumption may rise as a side effect, so we add the customer value variable of power consumption on the other side and express the trade-off relationship in a diagram.
This is not a cause-and-effect map that represents everything about the toaster. It is a partial cause-and-effect map that focuses on the most important customer value variable, “baking time.
When you are trying to innovate in product development, it is enough to focus on the variables you are interested in if you want to draw a causal relationship map for the purpose of how and where to attack.
Understand that a causal map is not meant to be completed, but may change its completeness and appearance depending on the purpose of use.
Now, let’s say we are considering how to reduce the baking time.
Improvements in the heater itself and the reflector may come to mind from the above diagram.
Now, let’s see if there are any new design variables other than the three that affect the baking time.
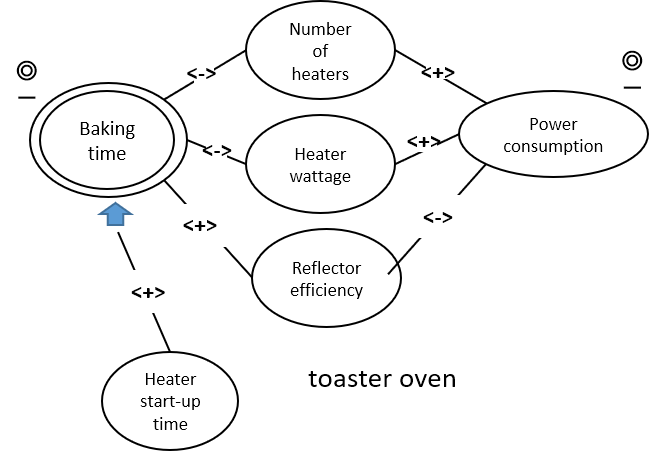
As shown in the figure, we hypothesize that we can reduce the baking time by shortening the heater rise time to a breakthrough level.
In this way, we developed a unique heater that could make a breakthrough, and as a result, we were able to not only reduce the baking time, but also bake tastier bread than other companies’ toasters, leading to a huge hit.
A cause-and-effect map expresses the composition and principles of existing products, and this can be used as a tool to find the technical issues you are facing and the places to attack for improving customer value.
Points to keep in mind when creating a causal map
Of course, the completed causal map is important, but I think the process of creating it is the most important.
In the process of creating a causal map, there are many insights that can be gained through discussions with members.
I believe this is the true value of the causal map.
In fact, there is no right answer to the causal map.
Even the content will change depending on the purpose of use.
First of all, please refer to the five ways of using it listed above and try to create it according to your purpose.
Until you get used to it, we recommend that you create it while having a contentious discussion with your team members.
On top of that, please keep the following in mind.
- Don’t try to make something perfect
Engineers may have a tendency to take these frameworks too seriously.
For example, when creating customer value variables, they may include too much detail and make the map more complex than necessary.
Just create it at a level that suits your purpose. - Concentrate on the important parts
Again, in order to get what you want to get from your objective, it is important to concentrate on the important parts and not dig too deep into unnecessary areas. - If there is something you don’t know, admit it honestly
Knowing what you don’t know is also a part of learning.
Consider that by knowing what you don’t know and turning it into what you do know, you and your organization will progress. - Ask yourself if this is really the right thing to do, and create something you are satisfied with
This may contradict the idea of not trying to create something perfect, but if it is inadequate for the purpose, it is meaningless.
I believe that in order to achieve your goal, you must not compromise
Summary
Although not as famous as the A3 report, the causal map is a very powerful tool in lean product development.
I think it can be effective even if it is used separately from the Lean development methodology.
However, as is the case with the A3 report, it may not be very meaningful even if it is used in a small part of the organization.
As an organization, we need to make sure that people know how to use it and are convinced of its effectiveness, as well as create and operate a high-quality causal relationship map.
Once again, I would like to note how to utilize it.
- Understand the general structure of the product system
- Clarify the trade-off relationships between customer value variables
- As a clue to the cause of a problem in order to solve it
- Understand what you don’t know
- To find a place to attack for innovation
I believe these five are the basics.
Let’s incorporate the causal map (cause-and-effect map) into our product development process and transform ourselves into an organization that continuously innovates.
![]()